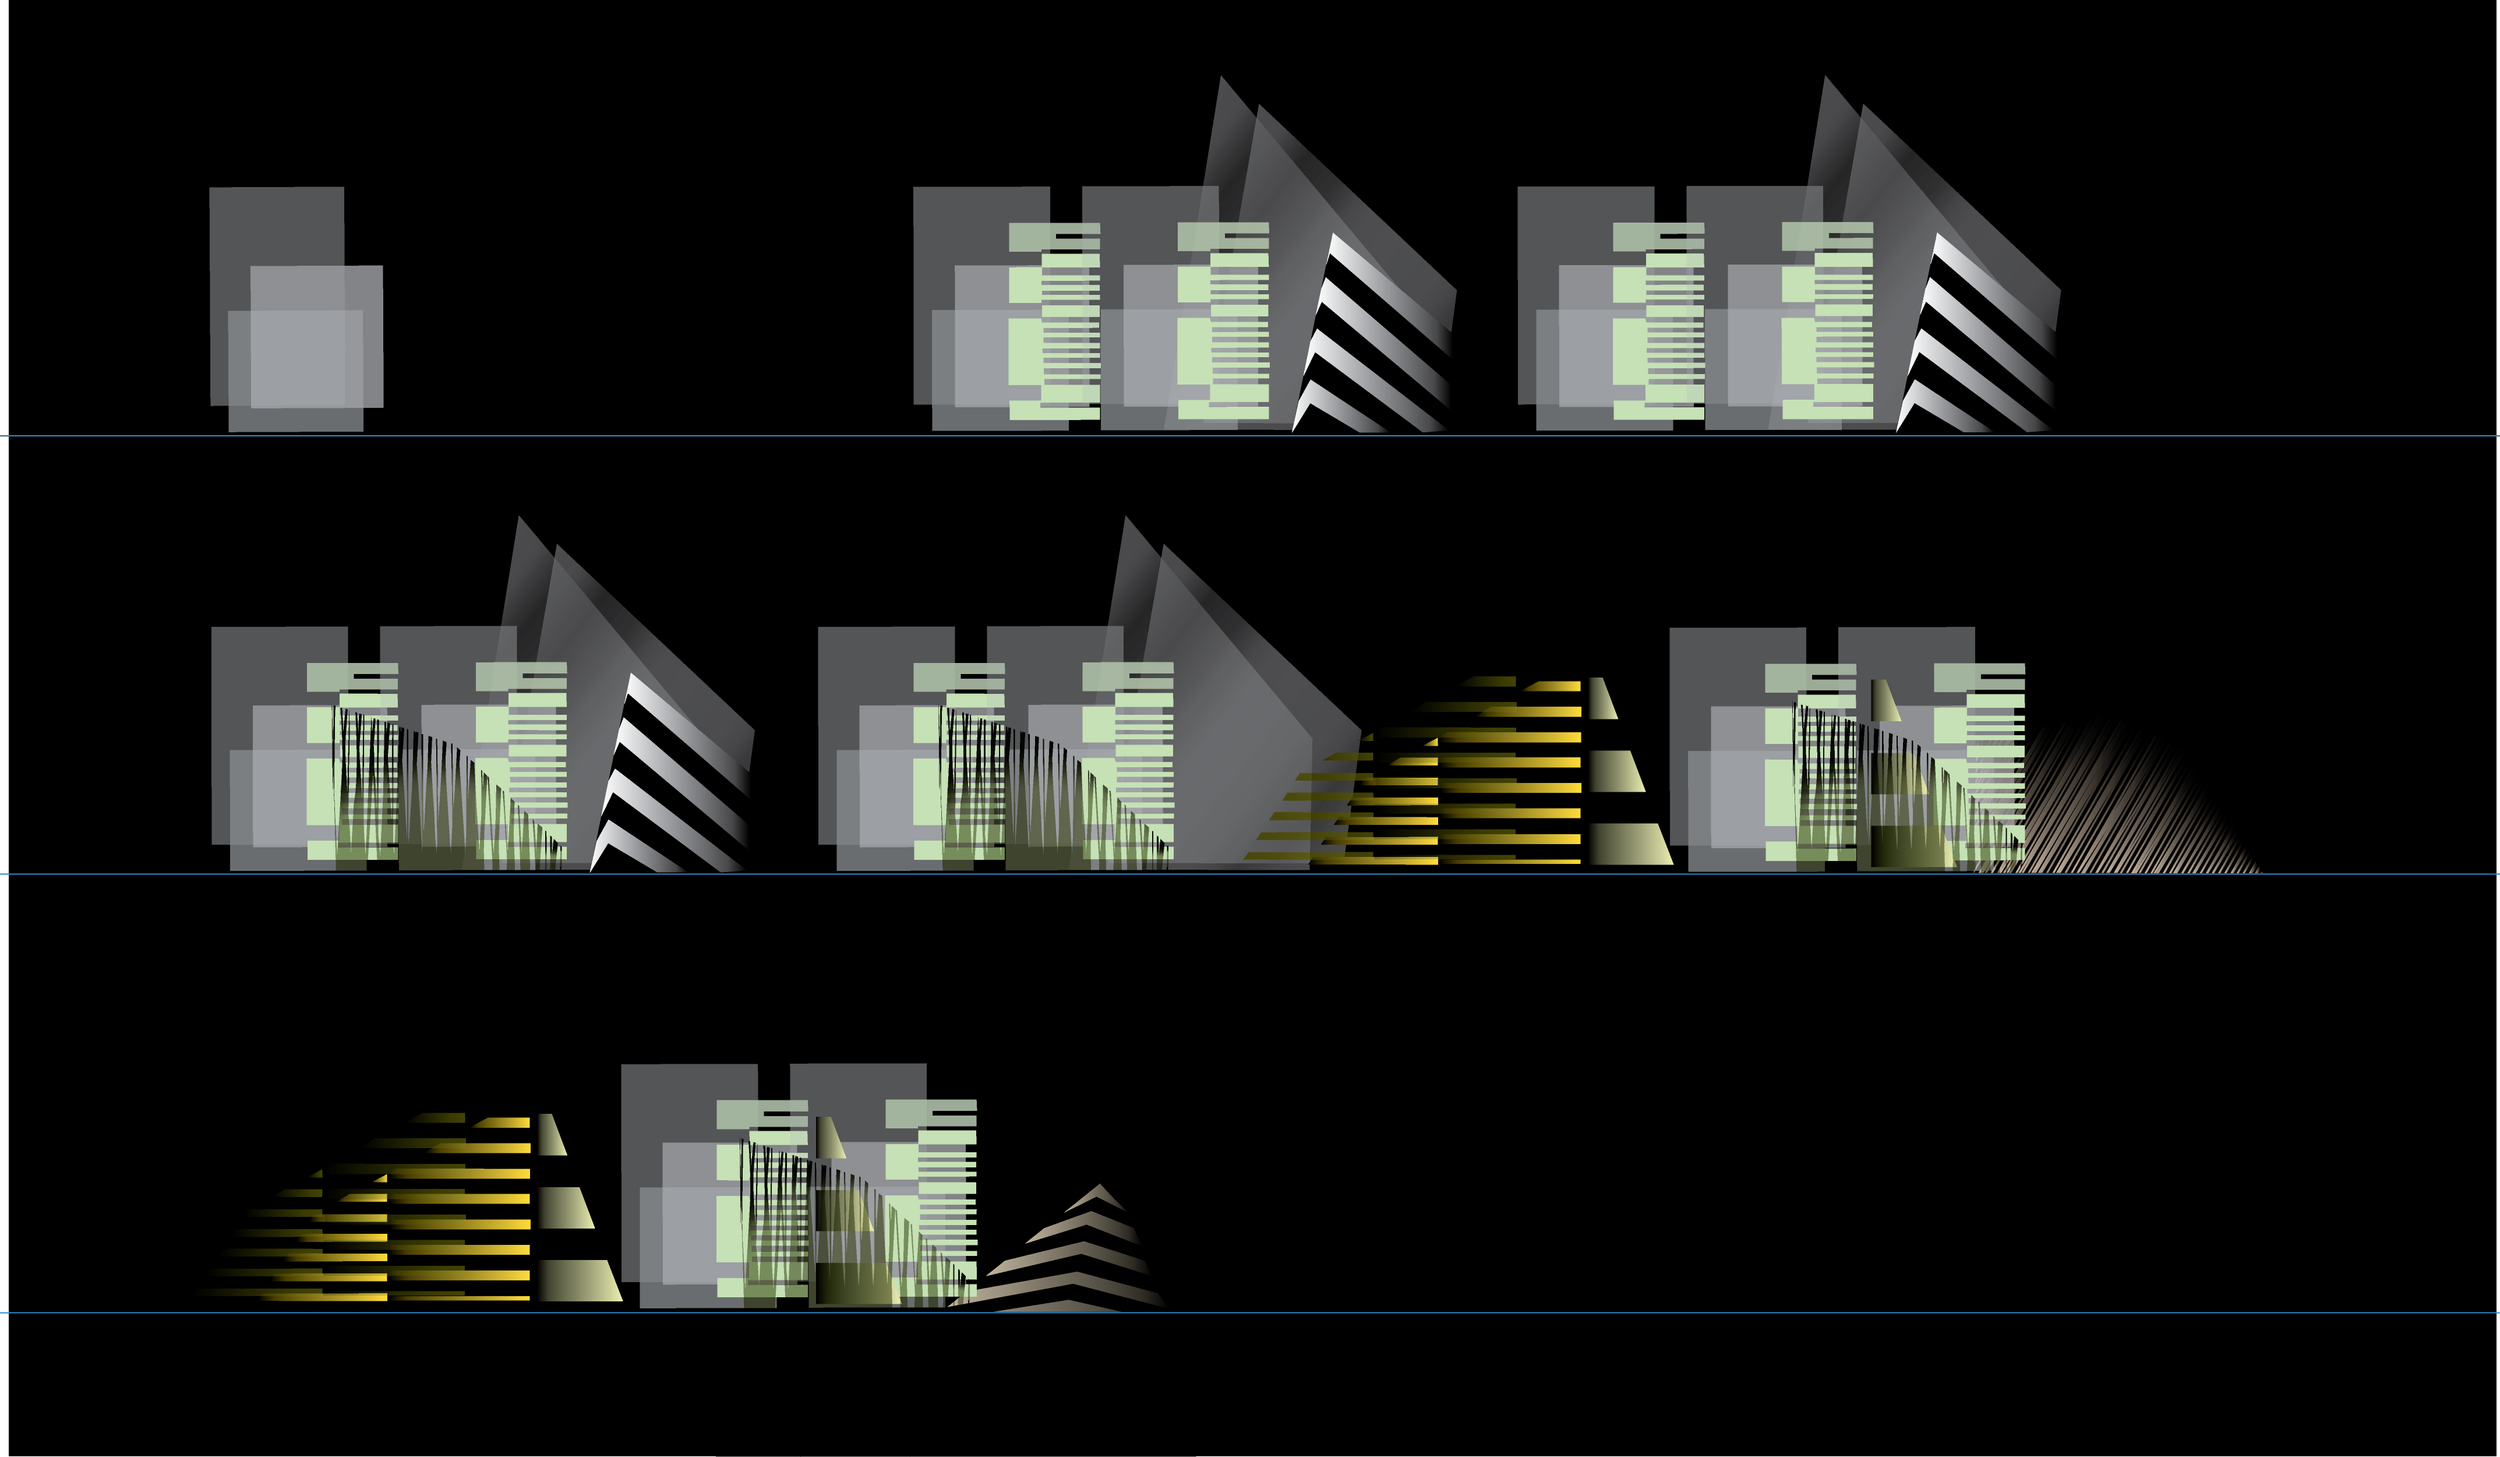
KLANGBILD
Sound Visualization
DATE: March 2010
SERVICES: Data Visualization, Sound Visualization
TOOLS: Illustrator, PSD
Project Goals
Question: "Is it possible to visualise an acoustic composition in such a way that the underlying system is recognisable and comprehensible? Does this give rise to approaches for application in design?" The starting point for this sound visualisation was a simple sound that only fixates on the parameter representation, i.e. without decisively considering emotional factors such as form and colour. I had the idea of creating a moving diagram in which it would be possible to see how many tracks there are, how they change in pitch and that they are connected in such a way that the individual elements of the tracks are understood as a whole, as a system.
Creative Solution
The colour of the shapes is not subjective but serves the sole purpose of differentiation. the purpose of differentiation. The idea comes from the fact that colouring cannot be justified and is seldom comprehensible to others. comprehensible. Derived from the system of automatic colour assignment, the shapes are assigned their colour according to a certain system. Starting from the number of traces, the colour circle is divided by these (in this case there are the colour wheel is divided by the number of tracks (in this case there are nine tracks) and the the order of appearance, so that up to the last element, but this gradually blends through changes in the song structure. gradually blends through changes in the structure of the song.
SOUND SYSTEMATIK
-

KLANGKÖRPER
-

TONHÖHE
FARBKLIMA
Klangbild
I adapted the short sound track to a music grid with its different sounds (tam, schhh, bong, klickklick, dingding, tata, klatsch, ritsch, zitt) and listed them. On the basis of this, the sound elements were defined and placed in the colour climate provided for them.


